Search for Indicators
All Data
Indicator Gauge Icon Legend
Legend Colors
Red is bad, green is good, blue is not statistically different/neutral.
Compared to Distribution
 the value is in the best half of communities.
 the value is in the 2nd worst quarter of communities.
 the value is in the worst quarter of communities.
Compared to Target
 meets target;
  does not meet target.
Compared to a Single Value
 lower than the comparison value;
 higher than the comparison value;
 not statistically different from comparison value.
Trend

 non-significant change over time;
 significant change over time;
  no change over time.
Compared to Prior Value
 higher than the previous measurement period;
 lower than the previous measurement period;
 no statistically different change from previous measurement period.
Health District: Rappahannock
Health / Cancer
Value
Compared to:
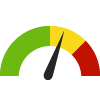
Health District: Rappahannock All Cancer Incidence Rate
Health District: Rappahannock All Cancer Incidence Rate
399.7
Cases per 100,000 population
(2020)
Compared to:

VA Health Districts
The distribution is based on data from 35 Virginia health districts.
VA Value
(384.8)
The regional value is compared to the Virginia State value.
Prior Value
(451.1)
Prior Value compares a measured value with the previously measured value. Confidence intervals were not taken into account in determining the direction of the comparison.
Trend
This comparison measures the indicator’s values over multiple time periods.<br>The Mann-Kendall Test for Statistical Significance is used to evaluate the trend<br>over 4 to 10 periods of measure, subject to data availability and comparability.
Health District: Rappahannock Brain Cancer Incidence Rate
Health District: Rappahannock Brain Cancer Incidence Rate
6.8
Per 100,000 population
(2020)
Compared to:

VA Value
(6.0)
The regional value is compared to the Virginia State value.
Prior Value
(5.6)
Prior Value compares a measured value with the previously measured value. Confidence intervals were not taken into account in determining the direction of the comparison.
Trend
This comparison measures the indicator’s values over multiple time periods.<br>The Mann-Kendall Test for Statistical Significance is used to evaluate the trend<br>over 4 to 10 periods of measure, subject to data availability and comparability.
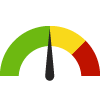
Health District: Rappahannock Breast Cancer Incidence Rate
Health District: Rappahannock Breast Cancer Incidence Rate
124.9
Cases per 100,000 females
(2020)
Compared to:
VA Health Districts
The distribution is based on data from 35 Virginia health districts.
VA Value
(122.1)
The regional value is compared to the Virginia State value.
Prior Value
(140.6)
Prior Value compares a measured value with the previously measured value. Confidence intervals were not taken into account in determining the direction of the comparison.
Trend
This comparison measures the indicator’s values over multiple time periods.<br>The Mann-Kendall Test for Statistical Significance is used to evaluate the trend<br>over 4 to 10 periods of measure, subject to data availability and comparability.
Health District: Rappahannock Colon Cancer Screening: Sigmoidoscopy or Colonoscopy 50-75
Health District: Rappahannock Colon Cancer Screening: Sigmoidoscopy or Colonoscopy 50-75
79.0%
(2020)
Compared to:

VA Value
(70.1% in 2018)
The regional value is compared to the Virginia State value.
Prior Value
(67.7%)
Prior Value compares a measured value with the previously measured value. Confidence intervals were taken into account in determining the direction of the comparison.
Trend
This comparison measures the indicator’s values over multiple time periods.<br>The Mann-Kendall Test for Statistical Significance is used to evaluate the trend<br>over 4 to 10 periods of measure, subject to data availability and comparability.
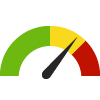
Health District: Rappahannock Colorectal Cancer Incidence Rate
Health District: Rappahannock Colorectal Cancer Incidence Rate
26.8
Cases per 100,000 population
(2020)
Compared to:
VA Health Districts
The distribution is based on data from 35 Virginia health districts.
VA Value
(30.4)
The regional value is compared to the Virginia State value.
Prior Value
(25.5)
Prior Value compares a measured value with the previously measured value. Confidence intervals were not taken into account in determining the direction of the comparison.
Trend
This comparison measures the indicator’s values over multiple time periods.<br>The Mann-Kendall Test for Statistical Significance is used to evaluate the trend<br>over 4 to 10 periods of measure, subject to data availability and comparability.
Health District: Rappahannock Liver and Bile Duct Cancer Incidence Rate
Health District: Rappahannock Liver and Bile Duct Cancer Incidence Rate
7.2
Cases per 100,000 population
(2020)
Compared to:
VA Health Districts
The distribution is based on data from 19 Virginia health districts.
VA Value
(6.3)
The regional value is compared to the Virginia State value.
Prior Value
(8.4)
Prior Value compares a measured value with the previously measured value. Confidence intervals were not taken into account in determining the direction of the comparison.
Trend
This comparison measures the indicator’s values over multiple time periods.<br>The Mann-Kendall Test for Statistical Significance is used to evaluate the trend<br>over 4 to 10 periods of measure, subject to data availability and comparability.
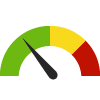
Health District: Rappahannock Lung and Bronchus Cancer Incidence Rate
Health District: Rappahannock Lung and Bronchus Cancer Incidence Rate
56.3
Cases per 100,000 population
(2020)
Compared to:
VA Health Districts
The distribution is based on data from 35 Virginia health districts.
VA Value
(47.7)
The regional value is compared to the Virginia State value.
Prior Value
(60.8)
Prior Value compares a measured value with the previously measured value. Confidence intervals were not taken into account in determining the direction of the comparison.
Trend
This comparison measures the indicator’s values over multiple time periods.<br>The Mann-Kendall Test for Statistical Significance is used to evaluate the trend<br>over 4 to 10 periods of measure, subject to data availability and comparability.
Health District: Rappahannock Mammogram in Past 2 Years: 50-74
Health District: Rappahannock Mammogram in Past 2 Years: 50-74
83.4%
(2020)
Compared to:
VA Value
(79.5%)
The regional value is compared to the Virginia State value.
Prior Value
(79.5%)
Prior Value compares a measured value with the previously measured value. Confidence intervals were taken into account in determining the direction of the comparison.
HP 2030 Target
(80.3%)
Health District: Rappahannock Melanoma Incidence Rate
Health District: Rappahannock Melanoma Incidence Rate
15.0
Cases per 100,000 population
(2020)
Compared to:
VA Health Districts
The distribution is based on data from 32 Virginia health districts.
VA Value
(19.3)
The regional value is compared to the Virginia State value.
Prior Value
(21.0)
Prior Value compares a measured value with the previously measured value. Confidence intervals were not taken into account in determining the direction of the comparison.
Trend
This comparison measures the indicator’s values over multiple time periods.<br>The Mann-Kendall Test for Statistical Significance is used to evaluate the trend<br>over 4 to 10 periods of measure, subject to data availability and comparability.
Health District: Rappahannock Non-Hodgkin Lymphoma Incidence Rate
Health District: Rappahannock Non-Hodgkin Lymphoma Incidence Rate
17.0
Cases per 100,000 population
(2020)
Compared to:
VA Health Districts
The distribution is based on data from 32 Virginia health districts.
VA Value
(15.9)
The regional value is compared to the Virginia State value.
Prior Value
(19.1)
Prior Value compares a measured value with the previously measured value. Confidence intervals were not taken into account in determining the direction of the comparison.
Trend
This comparison measures the indicator’s values over multiple time periods.<br>The Mann-Kendall Test for Statistical Significance is used to evaluate the trend<br>over 4 to 10 periods of measure, subject to data availability and comparability.
Health District: Rappahannock Oral Cavity and Pharynx Cancer Incidence Rate
Health District: Rappahannock Oral Cavity and Pharynx Cancer Incidence Rate
9.7
Cases per 100,000 population
(2020)
Compared to:

VA Health Districts
The distribution is based on data from 29 Virginia health districts.
VA Value
(11.3)
The regional value is compared to the Virginia State value.
Prior Value
(12.3)
Prior Value compares a measured value with the previously measured value. Confidence intervals were not taken into account in determining the direction of the comparison.
Trend
This comparison measures the indicator’s values over multiple time periods.<br>The Mann-Kendall Test for Statistical Significance is used to evaluate the trend<br>over 4 to 10 periods of measure, subject to data availability and comparability.
Health District: Rappahannock Ovarian Cancer Incidence Rate
Health District: Rappahannock Ovarian Cancer Incidence Rate
8.6
Cases per 100,000 females
(2020)
Compared to:
VA Value
(8.3)
The regional value is compared to the Virginia State value.
Prior Value
(10.4)
Prior Value compares a measured value with the previously measured value. Confidence intervals were not taken into account in determining the direction of the comparison.
Health District: Rappahannock Pancreatic Cancer Incidence Rate
Health District: Rappahannock Pancreatic Cancer Incidence Rate
13.2
Cases per 100,000 population
(2020)
Compared to:
VA Health Districts
The distribution is based on data from 27 Virginia health districts.
VA Value
(12.6)
The regional value is compared to the Virginia State value.
Prior Value
(15.3)
Prior Value compares a measured value with the previously measured value. Confidence intervals were not taken into account in determining the direction of the comparison.
Trend
This comparison measures the indicator’s values over multiple time periods.<br>The Mann-Kendall Test for Statistical Significance is used to evaluate the trend<br>over 4 to 10 periods of measure, subject to data availability and comparability.
Health District: Rappahannock Pap Test in Past 3 Years: 21-65
Health District: Rappahannock Pap Test in Past 3 Years: 21-65
89.0%
(2020)
Compared to:
VA Value
(79.8%)
The regional value is compared to the Virginia State value.
Prior Value
(82.8%)
Prior Value compares a measured value with the previously measured value. Confidence intervals were taken into account in determining the direction of the comparison.
Health District: Rappahannock Prostate Cancer Incidence Rate
Health District: Rappahannock Prostate Cancer Incidence Rate
100.3
Cases per 100,000 males
(2020)
Compared to:
VA Health Districts
The distribution is based on data from 35 Virginia health districts.
VA Value
(96.4)
The regional value is compared to the Virginia State value.
Prior Value
(124.5)
Prior Value compares a measured value with the previously measured value. Confidence intervals were not taken into account in determining the direction of the comparison.
Trend
This comparison measures the indicator’s values over multiple time periods.<br>The Mann-Kendall Test for Statistical Significance is used to evaluate the trend<br>over 4 to 10 periods of measure, subject to data availability and comparability.
Health District: Rappahannock
Health / Diabetes
Value
Compared to:
Health District: Rappahannock Adults with Diabetes
Health District: Rappahannock Adults with Diabetes
12.3%
(2021)
Compared to:
VA Health Districts
The distribution is based on data from 30 Virginia health districts.
VA Value
(11.5%)
The regional value is compared to the Virginia State value.
US Value
(10.9%)
The regional value is compared to the national value. The source for the national value is Behavioral Risk Factor Surveillance System
Prior Value
(11.0%)
Prior Value compares a measured value with the previously measured value. Confidence intervals were taken into account in determining the direction of the comparison.
Trend
This comparison measures the indicator’s values over multiple time periods.<br>The Mann-Kendall Test for Statistical Significance is used to evaluate the trend<br>over 4 to 10 periods of measure, subject to data availability and comparability.
Health District: Rappahannock
Health / Immunizations & Infectious Diseases
Value
Compared to:
Health District: Rappahannock Adults with Influenza Vaccination
Health District: Rappahannock Adults with Influenza Vaccination
43.5%
(2021)
Compared to:


VA Health Districts
The distribution is based on data from 22 Virginia health districts.
VA Value
(49.4%)
The regional value is compared to the Virginia State value.
Prior Value
(44.7%)
Prior Value compares a measured value with the previously measured value. Confidence intervals were taken into account in determining the direction of the comparison.
Trend
This comparison measures the indicator’s values over multiple time periods.<br>The Mann-Kendall Test for Statistical Significance is used to evaluate the trend<br>over 4 to 10 periods of measure, subject to data availability and comparability.
Health District: Rappahannock Adults with Pneumonia Vaccination
Health District: Rappahannock Adults with Pneumonia Vaccination
33.1%
(2021)
Compared to:
VA Health Districts
The distribution is based on data from 26 Virginia health districts.
VA Value
(34.3%)
The regional value is compared to the Virginia State value.
Prior Value
(30.6%)
Prior Value compares a measured value with the previously measured value. Confidence intervals were taken into account in determining the direction of the comparison.
Trend
This comparison measures the indicator’s values over multiple time periods.<br>The Mann-Kendall Test for Statistical Significance is used to evaluate the trend<br>over 4 to 10 periods of measure, subject to data availability and comparability.
Health District: Rappahannock
Health / Mental Health & Mental Disorders
Value
Compared to:
Health District: Rappahannock Adults Ever Diagnosed with Depression
Health District: Rappahannock Adults Ever Diagnosed with Depression
22.7%
(2021)
Compared to:
VA Health Districts
The distribution is based on data from 30 Virginia health districts.
VA Value
(19.6%)
The regional value is compared to the Virginia State value.
Prior Value
(12.2%)
Prior Value compares a measured value with the previously measured value. Confidence intervals were taken into account in determining the direction of the comparison.
Trend
This comparison measures the indicator’s values over multiple time periods.<br>The Mann-Kendall Test for Statistical Significance is used to evaluate the trend<br>over 4 to 10 periods of measure, subject to data availability and comparability.
Health District: Rappahannock Poor Mental Health Days
Health District: Rappahannock Poor Mental Health Days
37.9%
(2021)
Compared to:

VA Health Districts
The distribution is based on data from 26 Virginia health districts.
VA Value
(41.8%)
The regional value is compared to the Virginia State value.
Prior Value
(27.3%)
Prior Value compares a measured value with the previously measured value. Confidence intervals were taken into account in determining the direction of the comparison.
Trend
This comparison measures the indicator’s values over multiple time periods.<br>The Mann-Kendall Test for Statistical Significance is used to evaluate the trend<br>over 4 to 10 periods of measure, subject to data availability and comparability.
Health District: Rappahannock
Health / Physical Activity
Value
Compared to:
Health District: Rappahannock Adults Engaging in Physical Activity
Health District: Rappahannock Adults Engaging in Physical Activity
78.2%
(2021)
Compared to:
VA Health Districts
The distribution is based on data from 28 Virginia health districts.
VA Value
(79.1%)
The regional value is compared to the Virginia State value.
US Value
(76.3%)
The regional value is compared to the national value. The source for the national value is Behavioral Risk Factor Surveillance System
Prior Value
(81.5%)
Prior Value compares a measured value with the previously measured value. Confidence intervals were taken into account in determining the direction of the comparison.
Trend
This comparison measures the indicator’s values over multiple time periods.<br>The Mann-Kendall Test for Statistical Significance is used to evaluate the trend<br>over 4 to 10 periods of measure, subject to data availability and comparability.
Health District: Rappahannock
Health / Respiratory Diseases
Value
Compared to:
Health District: Rappahannock Adults with Asthma
Health District: Rappahannock Adults with Asthma
15.3%
(2021)
Compared to:
VA Health Districts
The distribution is based on data from 31 Virginia health districts.
VA Value
(15.0%)
The regional value is compared to the Virginia State value.
US Value
(14.9%)
The regional value is compared to the national value. The source for the national value is Behavioral Risk Factor Surveillance System
Prior Value
(10.0%)
Prior Value compares a measured value with the previously measured value. Confidence intervals were taken into account in determining the direction of the comparison.
Trend
This comparison measures the indicator’s values over multiple time periods.<br>The Mann-Kendall Test for Statistical Significance is used to evaluate the trend<br>over 4 to 10 periods of measure, subject to data availability and comparability.
Health District: Rappahannock
Health / Weight Status
Value
Compared to:
Health District: Rappahannock Adults who are Overweight or Obese
Health District: Rappahannock Adults who are Overweight or Obese
78.6%
(2021)
Compared to:

VA Health Districts
The distribution is based on data from 25 Virginia health districts.
VA Value
(68.1%)
The regional value is compared to the Virginia State value.
US Value
(68.3%)
The regional value is compared to the national value. The source for the national value is Behavioral Risk Factor Surveillance System
Prior Value
(70.3%)
Prior Value compares a measured value with the previously measured value. Confidence intervals were taken into account in determining the direction of the comparison.
Trend
This comparison measures the indicator’s values over multiple time periods.<br>The Mann-Kendall Test for Statistical Significance is used to evaluate the trend<br>over 4 to 10 periods of measure, subject to data availability and comparability.
Health District: Rappahannock
Health / Wellness & Lifestyle
Value
Compared to:
Health District: Rappahannock Self-Reported General Health Assessment: Good or Better
Health District: Rappahannock Self-Reported General Health Assessment: Good or Better
83.7%
(2021)
Compared to:

VA Health Districts
The distribution is based on data from 32 Virginia health districts.
VA Value
(85.0%)
The regional value is compared to the Virginia State value.
US Value
(84.6%)
The regional value is compared to the national value. The source for the national value is Behavioral Risk Factor Surveillance System
Prior Value
(91.4%)
Prior Value compares a measured value with the previously measured value. Confidence intervals were taken into account in determining the direction of the comparison.
Trend
This comparison measures the indicator’s values over multiple time periods.<br>The Mann-Kendall Test for Statistical Significance is used to evaluate the trend<br>over 4 to 10 periods of measure, subject to data availability and comparability.
